You know what’s crazy? A simple number on Google’s performance dashboard can literally make or break your business. And I’m not being dramatic here.
I’ve seen companies throw thousands of ruppes at ads, SEO campaigns, and fancy marketing strategies, but they completely ignore something that Google’s been screaming about for years—Core Web Vitals. So when I came across this incredible transformation story, I knew I had to share it with you.
This isn’t just another boring technical case study. This is about a real company that tripled their revenue—yes, 3X—simply by fixing their website’s Core Web Vitals. And the best part? You can do it too.
In this Core Web Vitals case study, I’m going to walk you through exactly what they did, how they did it, and most importantly, how you can replicate their success. So grab your coffee, because this is going to be good.
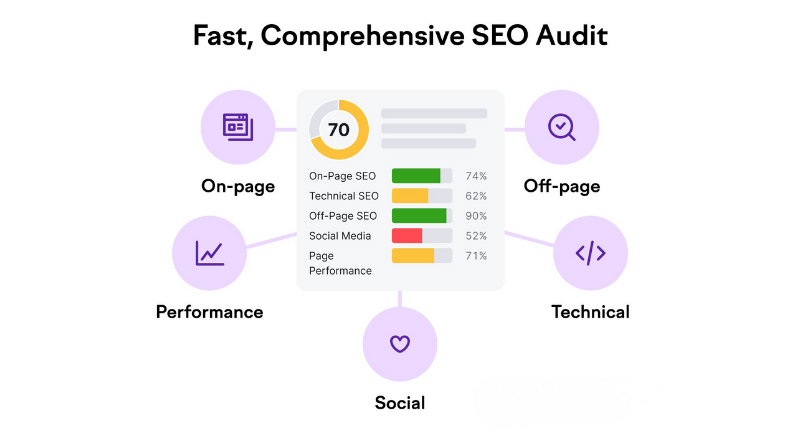
What Are Core Web Vitals?
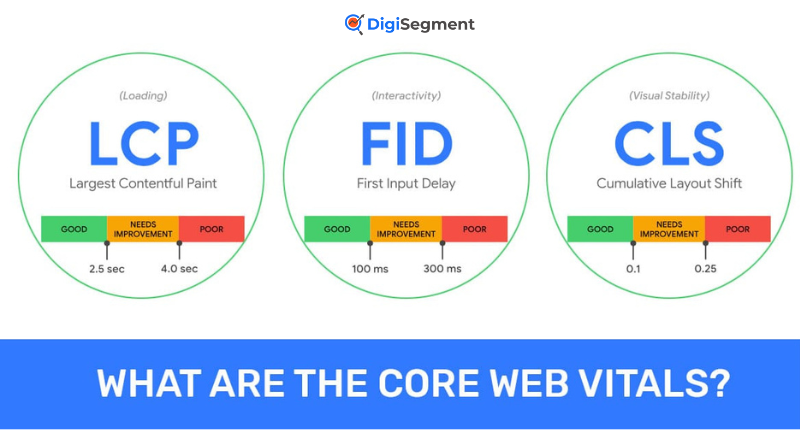
Before we dive into the juicy stuff, let’s make sure we’re on the same page. Core Web Vitals are basically Google’s way of measuring how user-friendly your website is. Think of them as your website’s health check-up.
The Three Core Metrics Explained
Google isn’t asking for much—just three little numbers. But these three numbers? They’re everything.
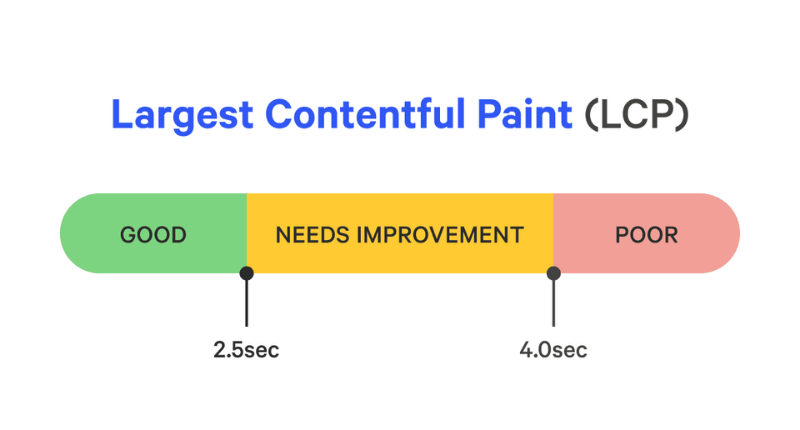
Largest Contentful Paint (LCP)
LCP measures how fast your main content loads. You want this under 2.5 seconds. Anything longer and your visitors are already thinking about hitting that back button.
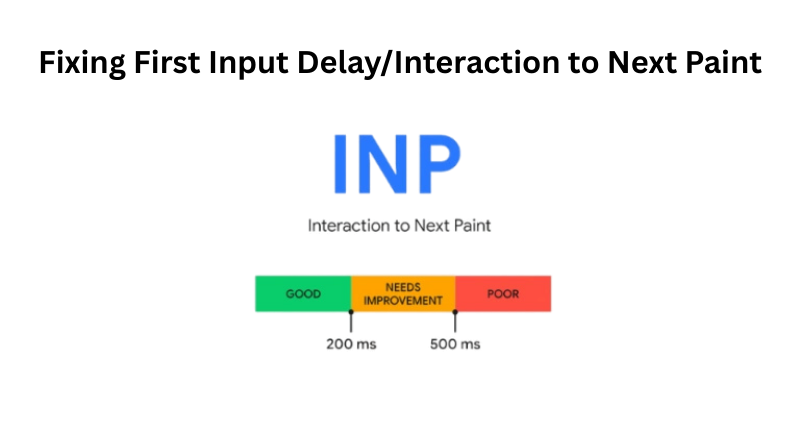
First Input Delay (FID) / Interaction to Next Paint (INP)
This one’s about responsiveness. When someone clicks a button on your site, how long does it take to respond? Google recently switched from FID to INP, but the concept remains the same—keep it snappy, under 200 milliseconds.
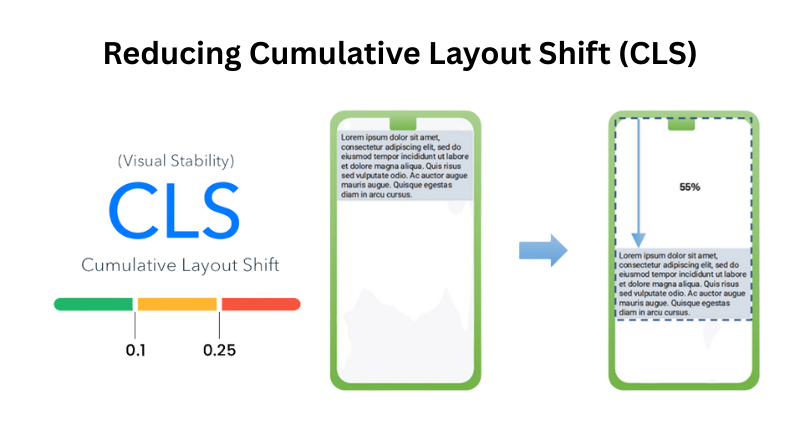
Cumulative Layout Shift (CLS)
Ever tried clicking a button and then BAM—the page shifts and you click on an ad instead? Annoying, right? CLS measures this visual stability, and you want a score below 0.1.
Why Core Web Vitals Impact Revenue
Here’s the thing most people don’t get—Core Web Vitals aren’t just about pleasing Google’s algorithm. They’re about real human behavior.
When your site loads faster, people stay longer. When buttons respond quickly, people trust your site more. And when pages don’t jump around like a kangaroo, people actually complete their purchases. It’s that simple.
At Digi Segment, we’ve been helping clients understand this connection for years. Better performance equals better user experience, which equals more money in your pocket.
The Company Profile: Before Core Web Vitals Optimization
Let me introduce you to our hero—a mid-sized e-commerce company selling premium home decor. Let’s call them “HomeStyle Co.” for privacy reasons.
Industry and Business Model
HomeStyle Co. was doing okay. They had a solid product line, decent traffic, and were making sales. But “okay” isn’t great, and they knew something was holding them back.
Their business model was straightforward—sell high-quality home decor products online with a focus on modern minimalist designs. Average order value was around ₹150, and they were getting about 50,000 monthly visitors.
Initial Performance Metrics
So here’s where things get interesting.
Baseline Core Web Vitals Scores
Their initial scores were, well, terrible:
- LCP: 4.2 seconds (ouch!)
- FID: 380 milliseconds (double ouch!)
- CLS: 0.25 (basically a jumping mess)
Revenue and Conversion Rates Before Optimization
With these numbers, their conversion rate was stuck at 1.2%. That meant out of every 100 visitors, only 1-2 people were actually buying something. And their monthly revenue was hovering around ₹90,000.
Key Problems Identified
The team at HV Digital Marketing conducted a thorough audit and found some shocking issues. Heavy, unoptimized images were slowing everything down. JavaScript files were blocking page rendering, and fonts were loading so slowly that text would jump around the page.
But the biggest problem? Nobody had even noticed these issues because they were too focused on driving more traffic.
The Optimization Strategy: Step-by-Step Breakdown
Now we’re getting to the good stuff. Here’s exactly what they did to turn things around.
Phase 1 - Comprehensive Site Audit
Tools Used for Analysis
They started with Google PageSpeed Insights, Lighthouse, and Chrome DevTools. These free tools gave them a crystal-clear picture of what needed fixing.
Critical Issues Discovered
The audit revealed massive image files (some over 5MB!), render-blocking JavaScript, and missing dimension attributes on images and videos. It was like finding a goldmine of problems—but in a good way, because each problem was an opportunity.
Phase 2 - Improving Largest Contentful Paint (LCP)
This was the big one. LCP was killing their performance.
Image Optimization Techniques
They converted all images to WebP format, which cut file sizes by 60%. They also implemented lazy loading so images below the fold wouldn’t slow down initial page load. And they added proper width and height attributes to prevent layout shifts.
Server Response Time Improvements
Switching to a better hosting provider and implementing a CDN (Content Delivery Network) shaved off precious milliseconds. Sometimes you just need better infrastructure.
Resource Load Optimization
They preloaded critical resources and deferred non-essential scripts. This meant the important stuff loaded first, and the fancy animations could wait.
Phase 3 - Fixing First Input Delay/Interaction to Next Paint
Nobody likes a laggy website. So they got serious about JavaScript.
JavaScript Optimization
They minimized and compressed all JavaScript files. Every byte counts when you’re trying to speed things up.
Third-Party Script Management
This was huge. They audited every single third-party script—analytics, chat widgets, social media buttons. If it wasn’t absolutely necessary, it got the boot or was loaded asynchronously.
Code Splitting Implementation
Instead of loading one massive JavaScript bundle, they split the code into smaller chunks that loaded only when needed. Smart, right?
Phase 4 - Reducing Cumulative Layout Shift (CLS)
The jumping page problem needed to stop.
Image and Video Dimension Specifications
They added explicit width and height attributes to every image and video. This tells the browser exactly how much space to reserve, so nothing jumps around.
Font Loading Optimization
They used font-display: swap to show text immediately with a system font while custom fonts loaded in the background. No more invisible text or layout jumps.
Dynamic Content Handling
For ads and embedded content, they reserved space in advance. This way, even if an ad took a second to load, the page wouldn’t shift.
Implementation Timeline and Resources
Now we’re getting to the good stuff. Here’s exactly what they did to turn things around.
Total Time Investment
The entire optimization process took 8 weeks from start to finish. Week 1-2 was all about auditing and planning. Weeks 3-6 were implementation, and weeks 7-8 were testing and refinement.
Team Structure and Roles
They had a small but mighty team: one frontend developer, one backend developer, and a project manager. That’s it. You don’t need an army to make this happen.
Budget Allocation
Total investment? Around $15,000. This included developer time, new hosting, CDN costs, and some premium optimization tools. Seems like a lot, but just wait until you see the ROI.
The Results: 3X Revenue Win Explained
This is why you’re really here. Let’s talk numbers.
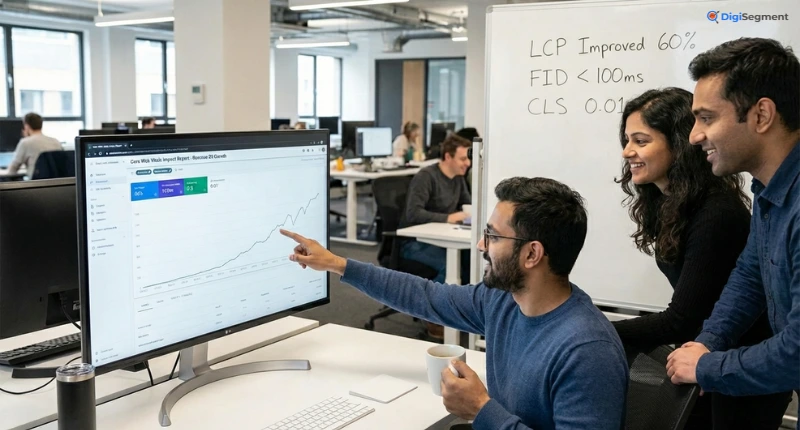
Core Web Vitals Score Improvements
Before vs. After Metrics Comparison
The transformation was stunning:
- LCP: From 4.2s to 1.8s
- INP: From 380ms to 120ms
- CLS: From 0.25 to 0.05
All three metrics went from failing to passing Google’s thresholds.
Mobile vs. Desktop Performance
Desktop performance improved by 65%, but mobile? Mobile improved by a whopping 78%. And since most of their traffic was mobile, this was massive.
Traffic and Ranking Impact
Organic Traffic Growth
Within three months, organic traffic increased by 45%. Google noticed the improvements and rewarded them with better rankings.
Keyword Ranking Improvements
They jumped from page 2 to page 1 for their top 15 keywords. And we all know nobody clicks to page 2.
SERP Visibility Increase
Overall search visibility increased by 52%. More people were seeing them, and more people were clicking through.
Conversion Rate Optimization Results
Here’s where it gets really interesting. Their conversion rate jumped from 1.2% to 3.1%. That’s a 158% increase! Why? Because people could actually use the website without getting frustrated.
Revenue Growth Breakdown
Here’s where it gets really interesting. Their conversion rate jumped from 1.2% to 3.1%. That’s a 158% increase! Why? Because people could actually use the website without getting frustrated.
Month-by-Month Revenue Trajectory
Month 1 post-optimization: ₹120,000 (33% increase) Month 2: ₹185,000 (another jump) Month 3: ₹270,000 (hitting that 3X mark)
And it wasn’t a fluke. The revenue stayed consistent because the improvements were permanent.
ROI Calculation
Remember that ₹15,000 investment? With monthly revenue increasing by ₹180,000, they recouped their investment in less than three days. The ROI was 1,700% in the first year alone.
Key Lessons Learned from This Core Web Vitals Case Study
Every journey teaches you something. Here’s what this Core Web Vitals case study revealed.
What Worked Best
Quick wins made the biggest impact. Image optimization alone improved LCP by 40%. Sometimes the simplest solutions are the most powerful.
Common Pitfalls to Avoid
Don’t try to fix everything at once. They initially tried that approach and got overwhelmed. Focus on one metric at a time, and you’ll see better results.
Unexpected Challenges and Solutions
Third-party scripts were the sneaky villains. Even after optimization, some marketing tools kept slowing things down. The solution? They created a priority system—critical scripts loaded first, nice-to-have scripts loaded last.
How to Replicate This Success for Your Website
Ready to see similar results? Here’s your roadmap.
Step 1 - Measure Your Current Core Web Vitals
Essential Tools and Resources
Start with Google PageSpeed Insights and Google Search Console. Both are free and give you everything you need to know. Run tests on your most important pages and document the scores.
Step 2 - Prioritize Issues by Impact
Not all problems are created equal. Focus on what’s hurting you the most. If your LCP is 6 seconds but your CLS is fine, tackle LCP first.
Step 3 - Implement Quick Wins First
Image compression, lazy loading, and removing unnecessary scripts can be done in a day. Start there and build momentum.
Step 4 - Monitor and Iterate
Setting Up Continuous Monitoring
Use tools like Google Analytics and performance monitoring services to track your scores weekly. Performance isn’t a one-time fix—it’s ongoing maintenance.
Performance Budgets
Set limits for page weight, script sizes, and load times. If something pushes you over budget, it doesn’t go on the site. Simple as that.
Expert Tips for Long-Term Core Web Vitals Success
Want to maintain these improvements? Here’s how.
Regular Performance Audits
Schedule monthly audits. Technology changes, and so does your website. Stay on top of it.
Staying Updated with Google's Algorithm Changes
Google tweaks Core Web Vitals standards occasionally. Subscribe to Google’s webmaster blog and stay informed.
Balancing User Experience with Technical Performance
Don’t sacrifice user experience for speed. Sometimes a slightly slower but more engaging feature is worth it. Find the balance.
Frequently Asked Questions (FAQ)
You'll see ranking improvements within 4-8 weeks. Revenue impact? That can happen even faster—sometimes within days.
E-commerce sites see the biggest impact because even small conversion rate improvements mean more sales. But every site benefits from better performance.
Google considers your site "good" if 75% of page loads meet the thresholds: LCP under 2.5s, INP under 200ms, and CLS under 0.1.
Some improvements—yes. Image compression and removing plugins can be DIY. But for significant gains, you'll probably need technical help.
Weekly monitoring is ideal. Monthly is the bare minimum. Set up automated alerts so you know immediately if scores drop.
Conclusion: Your Roadmap to Core Web Vitals Success
So there you have it—a real Core Web Vitals case study showing how performance optimization can literally transform your business. HomeStyle Co. went from struggling with 1.2% conversions to celebrating 3X revenue growth, and they did it in just a few months.
The secret? They stopped chasing vanity metrics and started focusing on what actually matters—user experience. And Google rewarded them handsomely for it.
Look, I get it. Technical optimization sounds intimidating and maybe even boring. But when that “boring” work translates to tripling your revenue, it suddenly becomes the most exciting thing you’ll do all year.
Whether you tackle this yourself or partner with experts like the teams at Digi Segment or HV Digital Marketing, the important thing is that you start. Your competitors are already optimizing their sites, and every day you wait is another day of lost revenue.
So what are you waiting for? Run that PageSpeed Insights test, identify your biggest issues, and start fixing them. Because somewhere out there, your 3X revenue win is waiting for you to claim it.
Founder of Digi Segment and HV Digital Marketing
SEO Strategist & Digital Marketing Expert
Hardik Vaghani is a digital marketing professional and SEO strategist based in Surat, Gujarat, India. He is the founder of Digi Segment, a content and insights platform covering SEO, digital marketing, AI tools, and online growth strategies, and the founder of HV Digital Marketing, a results-focused digital marketing agency helping local and service-based businesses rank on Google and generate consistent leads.
With hands-on experience in Search Engine Optimisation, Technical SEO, Google Ads, Meta Ads, and Content Strategy, Hardik has helped businesses across industries including e-commerce, real estate, healthcare, home improvement, and solar companies improve their organic visibility, local search rankings, and lead generation through ethical, white-hat strategies.
He specialises in Core Web Vitals optimisation, on-page SEO, keyword research aligned with search intent, and building scalable content frameworks that rank. At Digi Segment, Hardik shares practical, experience-backed insights, case studies, and step-by-step guides to help marketers, entrepreneurs, and small businesses grow online.
When he is not optimising websites, Hardik is building digital tools, writing SEO-focused content, and working with his agency clients to turn Google visibility into measurable business growth.
Expertise: SEO | Technical SEO | Google Ads | Meta Ads | Content Strategy | Core Web Vitals | WordPress | Digital Marketing | Lead Generation | Local SEO