A client came to me in March with a site that had been live for two years. Traffic was flat. Rankings were flat. And when I opened Google Search Console, I found the real problem in about four minutes: 340 pages sitting in “Crawled – currently not indexed” and nobody had ever looked. That’s the gap this Google Search Console guide is built to close. Most people verify their site, glance at the overview graph once a month, and never touch the reports that actually move the needle.
I’ve been running SEO audits out of Surat for agency and personal clients since 2023, and Google Search Console is still the most underused free tool in this entire industry. Not because it’s hard. Because nobody shows you what’s past page one of the dashboard. That’s exactly the gap this Google Search Console guide fills.
The Short Version
Google Search Console gives you five reports that matter more than the rest combined: Performance, Coverage (now called Indexing), URL Inspection, Core Web Vitals, and the alert emails Google sends when something breaks. Used together, they tell you what’s ranking, what’s broken, and what to fix first – before a client or a boss asks why traffic dropped.
What Is Google Search Console and Why You Need This Guide
Google Search Console is Google’s free reporting tool for anyone who owns or manages a website. It shows you how Google’s crawlers see your pages, which queries bring in clicks, and where your technical setup is quietly costing you rankings.
Here’s the thing most beginner tutorials skip: verifying your property and submitting a sitemap is maybe 10% of the value. The other 90% sits in reports people open once and never touch again. If you’ve already been through the basics, our Google Search Console beginner’s guide covers setup step by step. This piece assumes you’re past that and want the parts that actually change outcomes.
GSC matters because it’s the only place you get first-party data straight from Google. Third-party rank trackers estimate. Search Console reports what actually happened – real clicks, real impressions, real crawl errors, no guessing involved.
Why Most People Stop at the Overview Page
The default Search Console dashboard shows a pretty graph and stops there. It doesn’t tell you which pages are bleeding impressions, why a category page vanished from the index, or which query just started converting. You have to go looking. That’s the entire premise of this guide – going looking, on purpose, every week.
Understanding the Performance Report: Clicks, Impressions, CTR
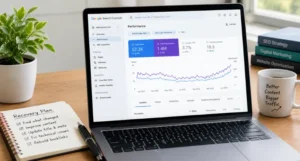
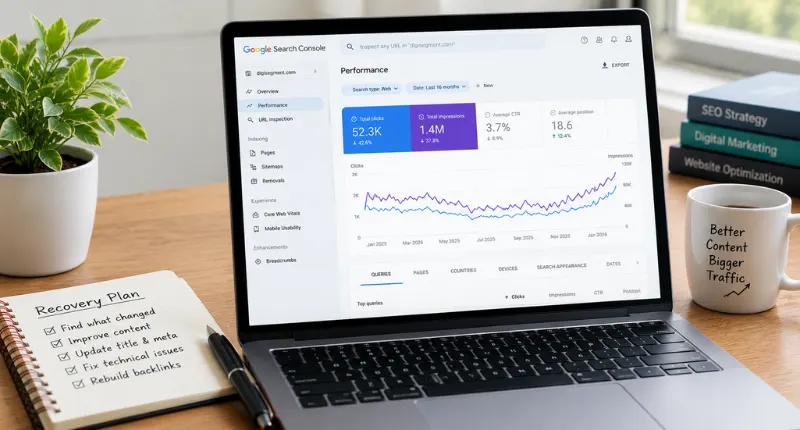
This is where most of your decisions should start. The Performance report breaks down four numbers: clicks, impressions, average CTR, and average position, and you can filter every one of them by query, page, country, device, and date.
Average position tells you where Google is showing your page. Impressions tell you how often it showed up. Clicks and CTR tell you whether people actually cared once they saw it. A page can rank #3 and still get almost nothing if the title tag is boring – that’s a CTR problem, not a ranking problem, and the fix is completely different.
Real numbers matter here, not vibes. First Page Sage’s 2026 click-through rate data found the top 3 organic search results receive more than two-thirds of all clicks on a Google search page, so if your page 1 rankings aren’t converting into traffic, something in your snippet is off. And AI Overviews have made this worse, not better – Ahrefs’ analysis of 300,000 keywords found AI Overviews correlate with a 58% reduction in click-through rate for top-ranking pages. Ranking #1 in 2026 isn’t the flex it used to be. (First Page Sage report · Ahrefs data via Outerbox)
Filtering by Query vs Filtering by Page
Filter by query when you want to know which searches are working. Filter by page when a specific URL is underperforming and you want to know exactly which queries are dragging its average position down. I do both every week, in that order – query first for the big picture, page second when something looks off.
How to Fix Indexing Issues Using the Coverage Report
Google Search Console renamed this the Indexing report a while back, but most SEOs still call it the Coverage report out of habit. Either name, it’s the second report I open on any audit, right after Performance.
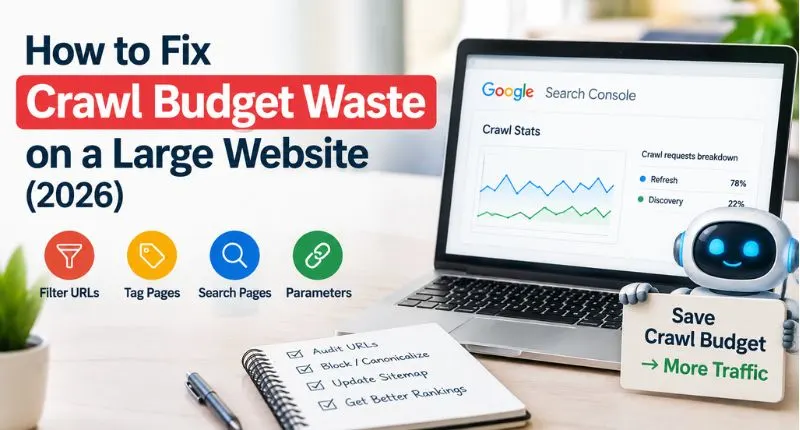
It sorts your URLs into buckets: indexed, not indexed, and excluded, each with a specific reason. The reasons matter more than the totals. “Crawled – currently not indexed” usually means thin or duplicate content Google decided wasn’t worth keeping. “Discovered – currently not indexed” often means a crawl budget issue on bigger sites. “Duplicate without user-selected canonical” means your canonical tags need attention, not your content.
Don’t panic at a big “Excluded” number. A lot of exclusions are intentional – paginated pages, filtered URLs, thank-you pages. The number to actually worry about is unindexed pages that should rank and currently don’t.
Reading the Coverage Report Like an Auditor, Not a Reader
Click into each error category individually instead of skimming the summary chart. Export the URL list, sort by folder or template, and look for patterns. If fifteen product pages share the same indexing error, that’s a template problem, not fifteen separate problems – fix it once at the template level and resubmit.
Using the URL Inspection Tool to Debug Specific Pages
This is the single-page version of everything above. Paste in any URL and Google Search Console tells you whether Google has it indexed, when it was last crawled, whether it’s mobile-friendly, and whether there’s a canonical mismatch.
Google caps how many URLs you can manually submit through this tool per property per day. One 2026 analysis put the practical daily limit at roughly 10 to 12 URLs per property through the URL Inspection Tool, so don’t waste submissions on pages that were never going to rank anyway. Save it for pages you’ve actually fixed. (source)
After you request indexing, be patient. That same analysis found turnaround typically runs a few hours to ten days, averaging three to five days. If a page still shows “URL is unknown to Google” after two weeks, the fix usually isn’t resubmitting again – it’s checking whether the page has enough internal links pointing to it in the first place. We cover that gap in our guide to link building fundamentals.
Core Web Vitals Report: How to Find and Fix Issues
The Core Web Vitals report inside Google Search Console groups your pages into Good, Needs Improvement, and Poor, based on three metrics: Largest Contentful Paint (loading speed), Interaction to Next Paint (responsiveness), and Cumulative Layout Shift (visual stability).
Poor scores here aren’t just a technical footnote – they can hold back rankings on competitive queries where content quality is roughly equal across the top results. I’ve watched a client’s product pages jump from Poor to Good after we compressed hero images and deferred non-critical JavaScript, and rankings on three commercial queries moved up within the following month. That’s not a coincidence, and it’s not magic either – it’s just Google finally being able to serve a page fast enough to trust it.
GSC’s Field Data vs Lab Tools Like PageSpeed Insights
Search Console shows field data – real Chrome users on real devices, over 28 days. PageSpeed Insights shows lab data – one simulated test run. They’ll disagree sometimes, and when they do, trust the field data in Search Console over the lab score. Real users don’t lie. Our Core Web Vitals case study walks through a full before-and-after if you want the longer version.
Finding Quick Win Keywords Using the Search Performance Report
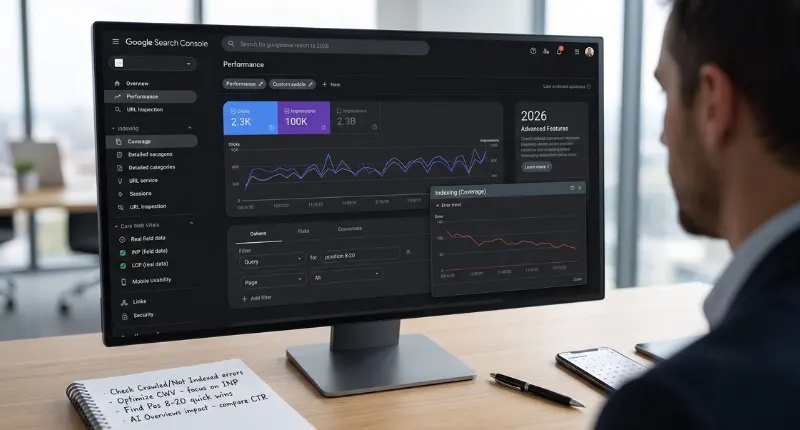
This is my favorite section of any Google Search Console guide, honestly, because it’s the fastest path to traffic that doesn’t need new content. Filter the Performance report by position 8 to 20 and sort by impressions, descending. You’re looking for queries Google already thinks you deserve to rank for – it’s just not confident enough yet to put you higher.
These “quick win” keywords usually need one of three things: a stronger H2 that matches the query intent, an internal link from a more authoritative page, or a slightly rewritten intro paragraph that answers the query faster. None of that is a rewrite. It’s a nudge.
I ran this exact filter for a solar client’s site last year and found eleven queries sitting at position 11-15 with real search volume. We updated on-page headers and added internal links from two case study pages – seven of those eleven moved into the top 10 within six weeks. No new content, no new backlinks. Just paying attention to a report most people never open.
How This Google Search Console Guide Fits Into a Weekly SEO Routine
Quick win hunting only works if you actually do it weekly, not quarterly. Rankings shift fast enough now that a query sitting at position 9 today can be gone from page one in a month if you don’t act on it.
Setting Up Email Alerts for Critical GSC Errors
Google Search Console will email you automatically for major issues – manual actions, security problems, and sharp indexing drops – but the default alerts are broad. For anything more specific, connect Google Search Console to Google Sheets or a monitoring tool through the API, and set thresholds yourself: a 20% drop in clicks week-over-week, a spike in 404s, or a sudden jump in “Crawled – currently not indexed” pages.
I know that sounds like overkill for a small site. It isn’t, once you’ve been burned once. A plugin update or a bad redirect can quietly deindex a section of a site for weeks before anyone notices without alerts. Set them up once and forget about them until they fire. Alerts are the part of any Google Search Console guide that people skip, and it’s usually the one they regret skipping.
How to Use Google Search Console: The Weekly Workflow
- Verify your property in Search Console and confirm ownership through DNS or an HTML tag.
- Submit your XML sitemap under the Sitemaps report so Google has a map of what to crawl.
- Check the Coverage (Indexing) report for errors and excluded pages.
- Review the Performance report for clicks, impressions, and average position trends.
- Filter by individual page when something looks off.
- Identify quick-win keywords sitting at position 8-20.
- Fix the errors you found, starting with the ones affecting the most pages.
- Monitor weekly, not monthly – problems compound fast when nobody’s watching. The result is a site where indexing issues get caught in days instead of months.
What Actually Happened With a Client Who Ignored GSC for a Year
In late 2025, a home improvement client came to me convinced their SEO agency had “stopped working.” Traffic was down almost 40% from its peak. Their previous agency had been sending monthly PDF reports full of green checkmarks and never once opened the Coverage report.
Turns out a site migration eight months earlier had left 200+ old URLs returning soft 404s, and Google had quietly stopped crawling large sections of the site. Nobody caught it because nobody was looking at Search Console – they were looking at a dashboard built from Search Console data, filtered to only show the good news.
We fixed the redirects, resubmitted the sitemap, and requested indexing on the highest-priority pages. It took about five weeks for the Coverage report to show most of those pages back to “Indexed.” Traffic recovered to about 85% of the previous peak within three months, and kept climbing from there. I’ll be honest – I still don’t know exactly why it never hit 100% of the old peak. Some of that traffic was probably queries that had shifted to AI Overviews in the meantime, not something a redirect fixes.
Search Console Quick Reference
| Report | What It Tells You | Check How Often |
| Performance | Clicks, impressions, CTR, position | Weekly |
| Coverage / Indexing | What’s indexed, excluded, or erroring | Weekly |
| URL Inspection | Live status of a single page | As needed |
| Core Web Vitals | Loading, responsiveness, stability | Monthly |
| Links | Internal and external link counts | Monthly |
| Email Alerts | Manual actions, security, crawl drops | Real-time |
Frequently Asked Questions
Is Google Search Console free to use?
Yes, completely. There’s no paid tier, no usage limit on properties for individual site owners, and no catch. Google makes money from search and ads, not from this tool.
How long does it take for GSC to show data?
New properties usually show Performance data within a few days of verification, though it can take up to 48 hours for the first numbers to populate. Historical data only goes back 16 months, so export anything older that you want to keep.
How do I submit my sitemap to Google Search Console?
Go to the Sitemaps report in the left sidebar, enter your sitemap URL (usually yoursite.com/sitemap.xml), and click Submit. Most WordPress SEO plugins generate this automatically.
What is the difference between impressions and clicks in GSC?
An impression counts every time your page appeared in search results, even if nobody clicked. A click only counts when someone actually visited your page. Divide clicks by impressions and you get CTR.
How do I fix crawl errors in Google Search Console?
Open the Coverage report, click into the specific error type, and check the affected URLs. Most crawl errors trace back to broken redirects, blocked resources in robots.txt, or server timeouts – fix the root cause, then use URL Inspection to request a recrawl.
Do I need both Google Search Console and Google Analytics?
Yes, and they answer different questions. Search Console shows what happens before someone lands on your site – impressions, rankings, clicks from Google. Analytics shows what happens after they arrive. You need both to see the full funnel.
Why does my Search Console traffic not match Google Analytics?
They measure differently. Search Console counts clicks in the search results, while Analytics counts sessions after tracking scripts load and bot filtering runs. A gap of 10-20% between the two is normal; anything larger usually points to a tracking or consent-banner issue.
Is this Google Search Console guide still relevant with AI Overviews taking over search?
More relevant, honestly. AI Overviews pull from indexed, well-structured pages, so keeping your indexing clean and your Core Web Vitals healthy through Search Console is part of how you get cited, not just ranked.

Founder, Digi Segment
SEO Strategist & Digital Marketing Expert
Hardik Vaghani is a digital marketing professional and SEO strategist based in Surat, Gujarat, India. He founded Digi Segment to share practical, experience-backed insights, case studies, and step-by-step guides on SEO, digital marketing, AI tools, and online growth strategies.
With hands-on experience across Search Engine Optimisation, Technical SEO, Google Ads, Meta Ads, and Content Strategy, Hardik has worked with businesses across e-commerce, real estate, healthcare, home improvement, and solar industries to improve organic visibility, local rankings, and lead generation through ethical, white-hat strategies.
He specialises in Core Web Vitals optimisation, on-page SEO, keyword research aligned with search intent, and building scalable content frameworks that rank.
Expertise: SEO | Technical SEO | Google Ads | Meta Ads | LinkedIn Ads | Pinterest Ads | ChatGPT Ads | Content Strategy | Core Web Vitals | WordPress | Digital Marketing | Lead Generation | Local SEO